Power Basis
A simple math structure to handle curves and surfaces is the power basis representation. Power basis representation uses polynomials, which are fast to compute and simple to handle.A $n^{th}$-degree power basis curve can be defined in the parametric space as:
$$\begin{eqnarray*} \boldsymbol{C}\left(\xi\right) & = & \left(x\left(\xi\right),y\left(\xi\right),z\left(\xi\right)\right)\\ & = & \sum_{i=0}^{n}\boldsymbol{a}_{i}\xi^{i}\\ & = & \left(\left[\boldsymbol{a}_{i}\right]_{i=0}^{n}\right)^{T}\left[\xi^{i}\right]_{i=0}^{n}, \end{eqnarray*}$$
where the functions $\xi^{i}$ are the basis (or blending) functions. Using the tensor product scheme we can also define a power basis surface:
$$\begin{eqnarray*} \boldsymbol{S}\left(\xi,\eta\right) & = & \left(x\left(\xi,\eta\right),y\left(\xi,\eta\right),z\left(\xi,\eta\right)\right)\\ & = & \sum_{i=0}^{n}\sum_{j=0}^{m}\boldsymbol{a}_{i,j}\xi^{i}\eta^{j}\\ & = & \left(\left[\xi^{i}\right]_{i=0}^{n}\right)^{T}\left[\boldsymbol{a}_{i,j}\right]_{i,j=0}^{i=n,j=m}\left[\eta^{j}\right]_{j=0}^{m} \end{eqnarray*}$$
where:
$$ \left\{ \begin{array}{l} \boldsymbol{a}_{i,j}=\left(x_{i,j},y_{i,j},z_{i,j}\right)\\ b\leq\xi\leq c\\ d\leq\eta\leq e \end{array}\right.$$
Bezier
Bezier curves do not increase the space of curves representable by the power basis form, but introduce the concept of control point. Control points convey a clear geometrical meaning, which is very useful during the design process. So, a $n^{th}$-degree Bezier curve is defined as:$$\boldsymbol{C}\left(\xi\right)=\sum_{i=0}^{n}B_{i}^{n}\left(\xi\right)\boldsymbol{P}_{i},\;a\leq\xi\leq b$$
where $\boldsymbol{P}_{i}$ represents the $i^{th}$ control point and:
$$B_{i}^{n}\left(\xi\right)=\frac{n!\cdot\xi^{i}\left(1-\xi\right)^{n-i}}{i!\cdot\left(n-i\right)!}$$
is the $i^{th}$ basis function (also known as Bernstein polynomial). With the tensor product scheme, we can also define a Bezier surface with:$$\boldsymbol{S}\left(\xi,\eta\right)=\sum_{i=0}^{n}\sum_{j=0}^{m}B_{i}^{n}\left(\xi\right)B_{j}^{m}\left(\eta\right)\boldsymbol{P}_{i,j},\;\left\{ \begin{array}{l} a\leq\xi\leq b\\ c\leq\eta\leq d \end{array}\right.$$
Octave Implementation
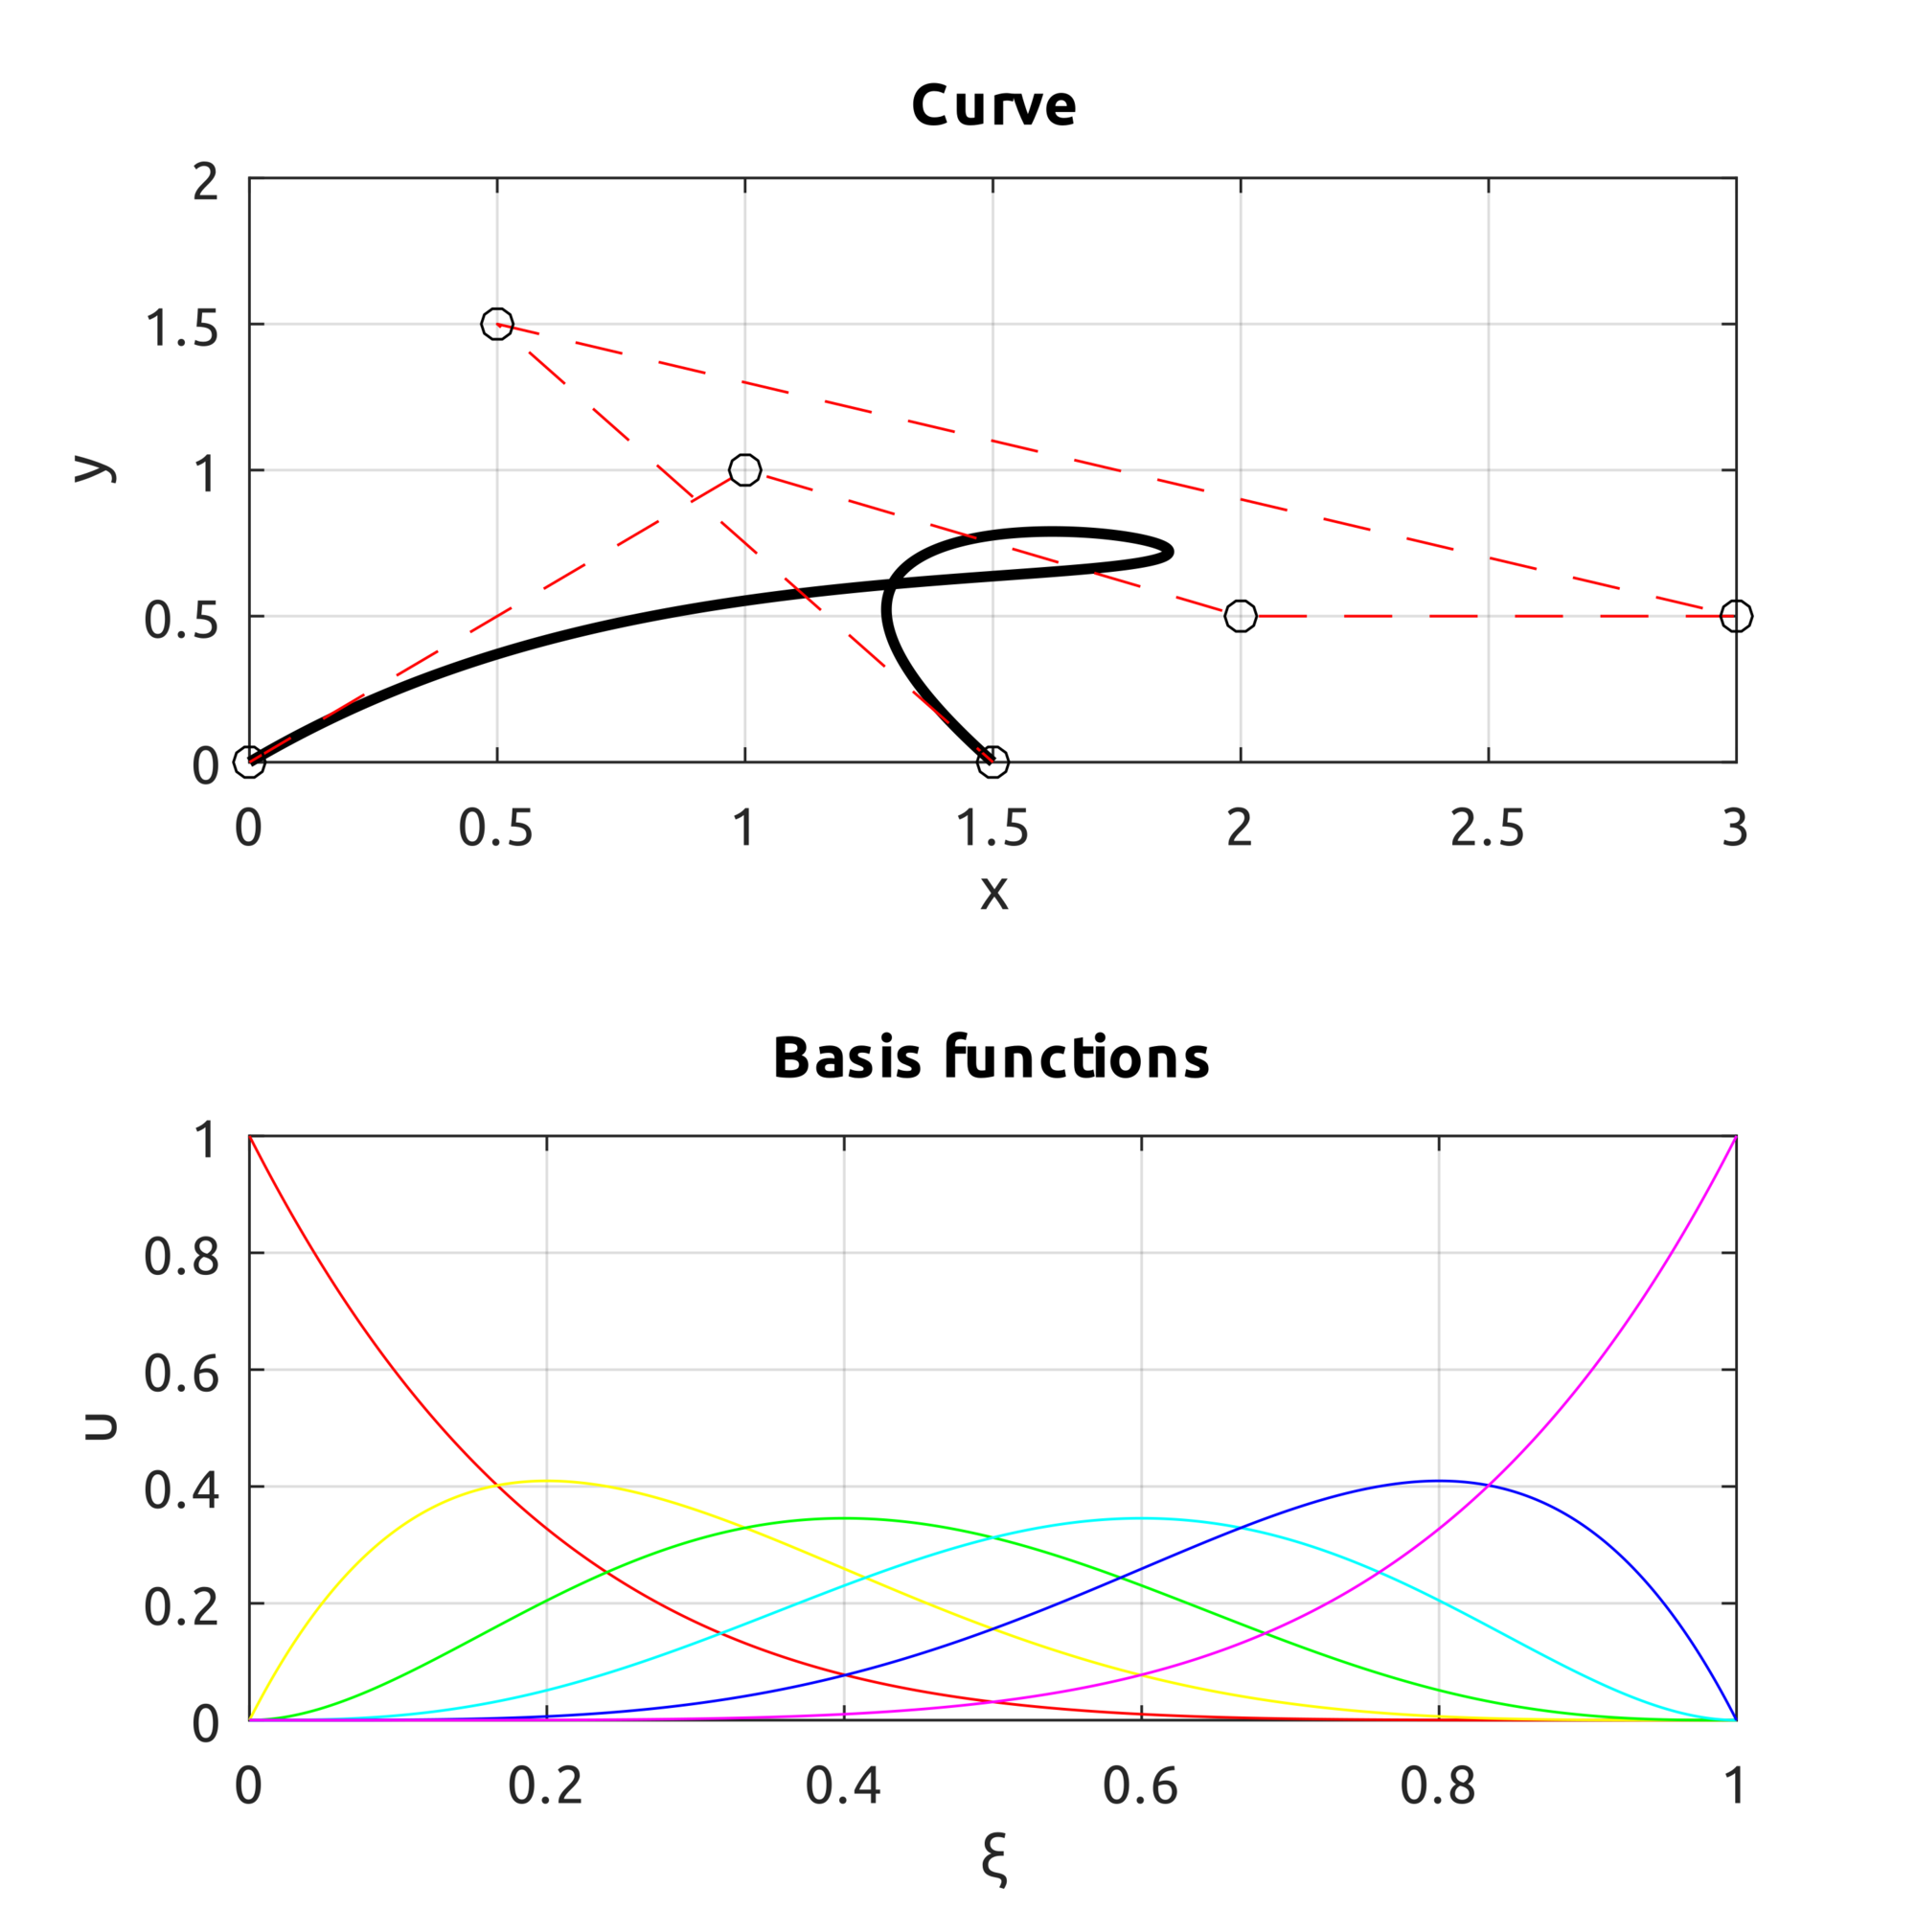
In the repo https://github.com/carlonluca/isogeometric-analysis, you can find a basic implementation of Bezier curves and surfaces written for Octave (and Matlab) in: https://github.com/carlonluca/isogeometric-analysis/tree/master/3.3. The implementation is tested with a few examples. For example, given these control points:$$\boldsymbol{P}_{0}=\left(0,0\right),\;\boldsymbol{P}_{1}=\left(1,1\right),\;\boldsymbol{P}_{2}=\left(2,0.5\right)$$ $$\boldsymbol{P}_{3}=\left(3,0.5\right),\;\boldsymbol{P}_{4}=\left(0.5,1.5\right),\;\boldsymbol{P}_{5}=\left(1.5,0\right)$$
we can get to this result by using the computeBezier.m script:
We can also define the curve in the 3D space. For example these control points:
$$\boldsymbol{P}_{0}=\left(0,0,0\right),\;\boldsymbol{P}_{1}=\left(1,1,1\right),\;\boldsymbol{P}_{2}=\left(2,0.5,0\right)$$ $$\boldsymbol{P}_{3}=\left(3,0.5,0\right),\;\boldsymbol{P}_{4}=\left(0.5,1.5,0\right),\;\boldsymbol{P}_{5}=\left(1.5,0,1\right)$$
lead to this result: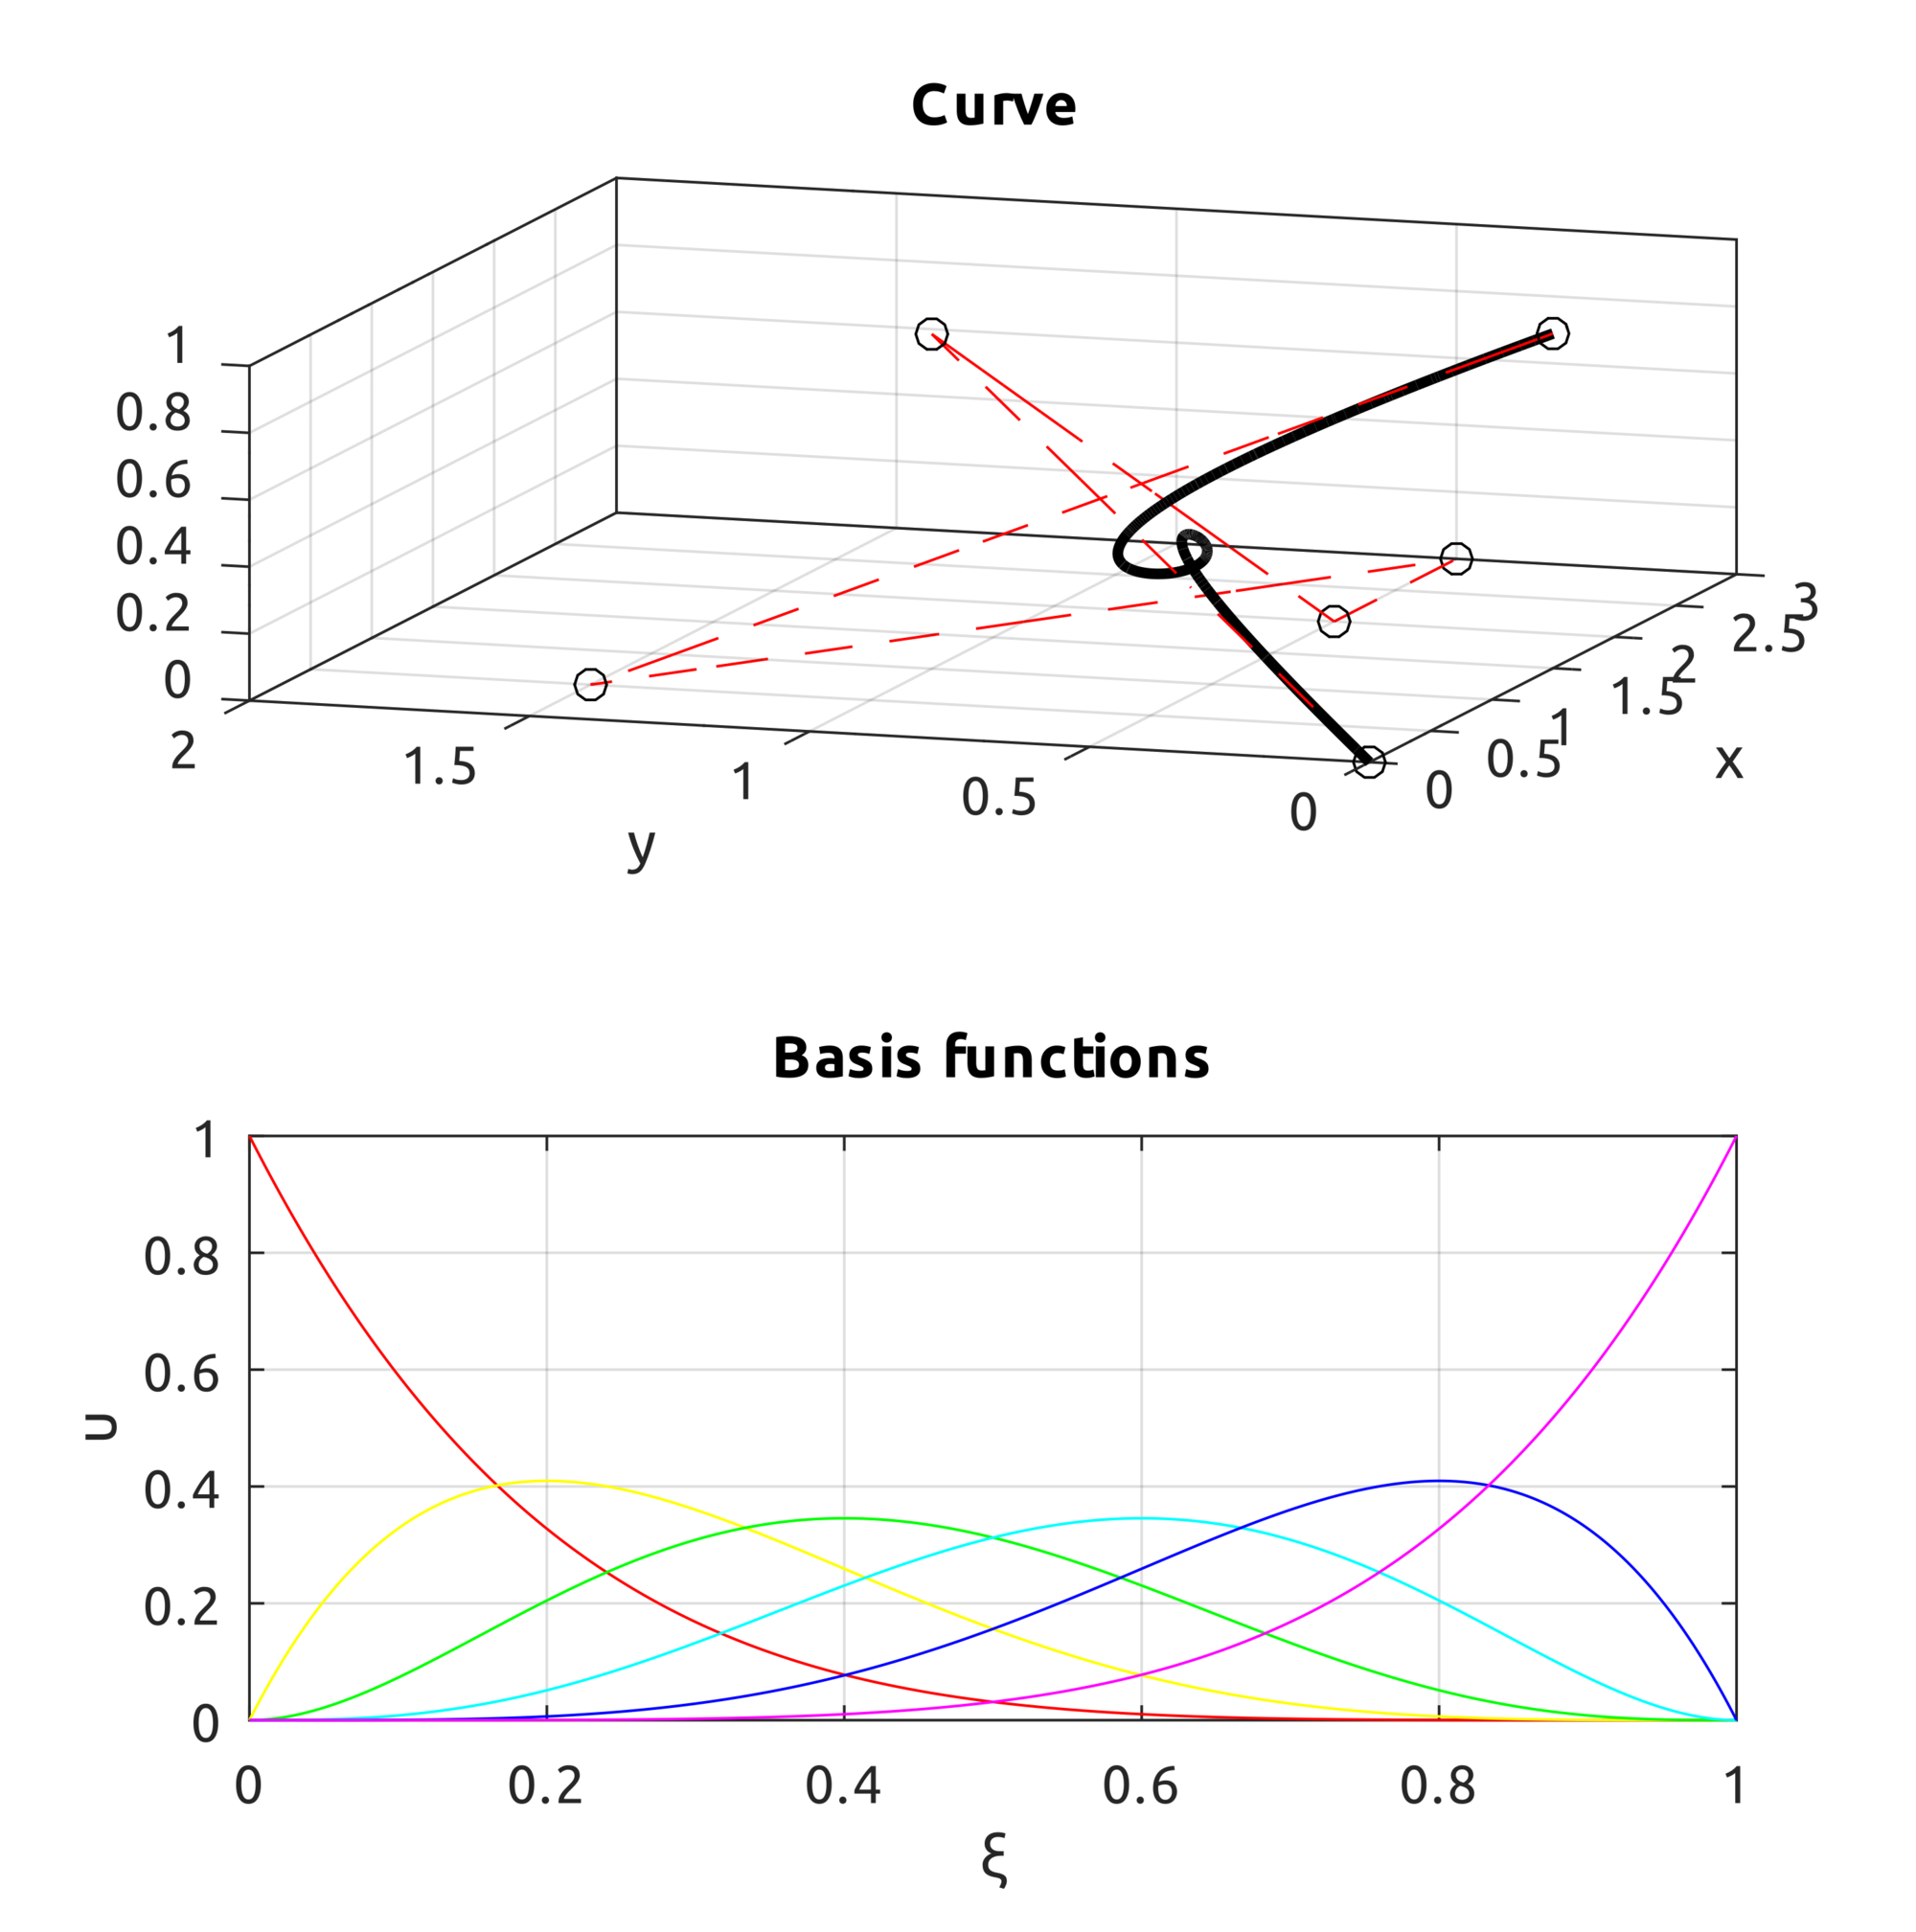
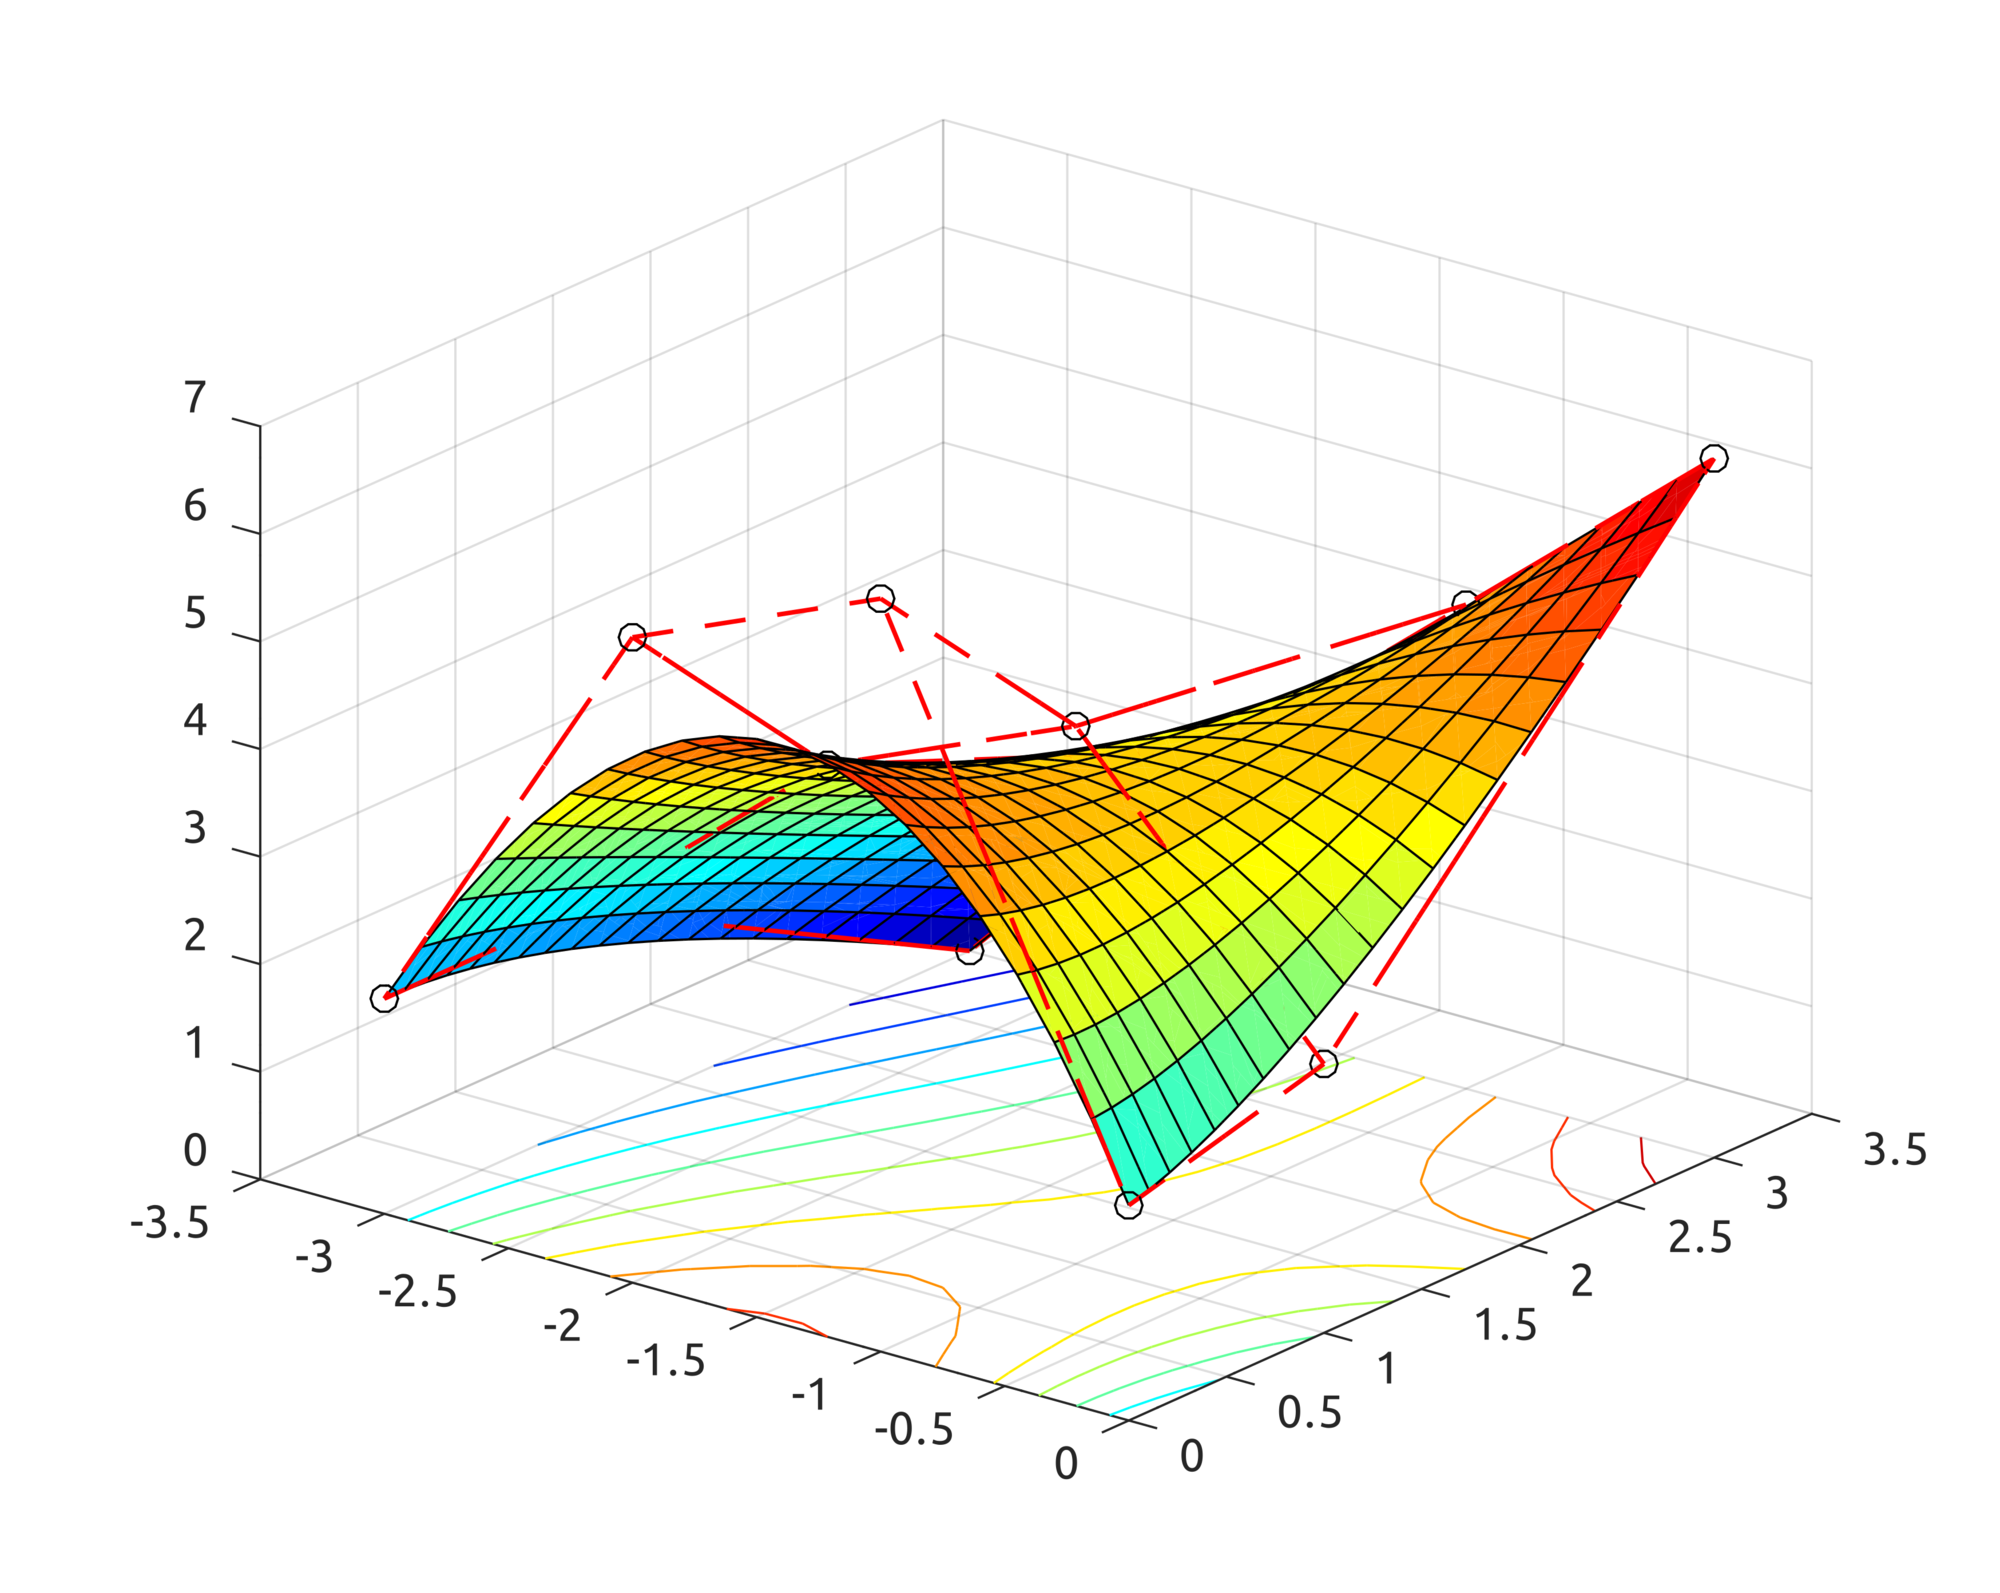
It may also be interesting to see what happens to a curve when a new control point is added to the previous one:
$$\boldsymbol{P}_{0}=\left(-3,0,2\right),\;\boldsymbol{P}_{1}=\left(-2,0,6\right),\;\boldsymbol{P}_{2}=\left(-1,0,7\right),\boldsymbol{P}_{3}=\left(0,0,2\right)$$ $$\boldsymbol{P}_{4}=\left(-3,1,2\right),\;\boldsymbol{P}_{5}=\left(-2,1,4\right),\;\boldsymbol{P}_{6}=\left(-1,1,5\right),\;\boldsymbol{P}_{7}=\left(0,1,2.5\right)$$ $$\boldsymbol{P}_{8}=\left(-3,3,0\right),\;\boldsymbol{P}_{9}=\left(-2,3,2.5\right),\;\boldsymbol{P}_{10}=\left(-1,3,4.5\right),\;\boldsymbol{P}_{11}=\left(0,3,6.5\right)$$
this is what the algorithms produce: